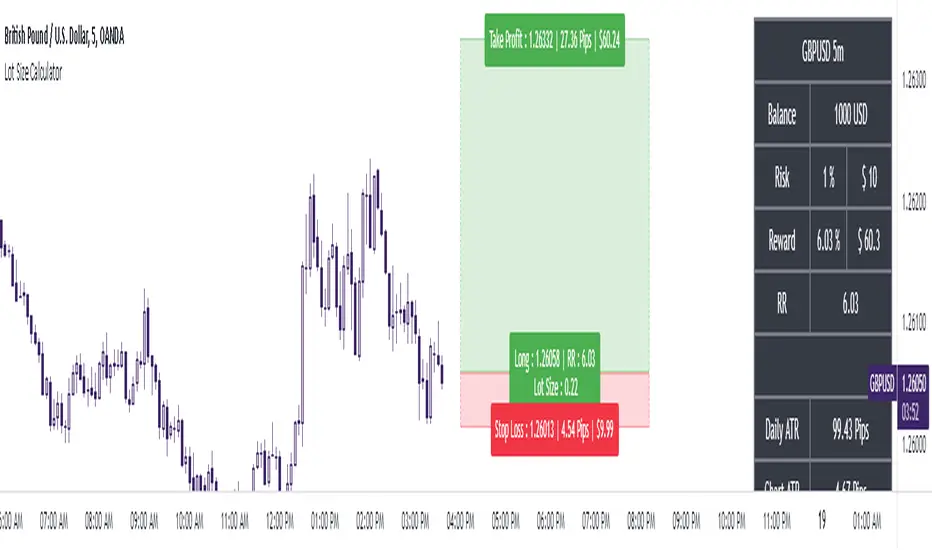
The Ultimate Lot Size Calculator Backstory
I created this Pine Script tool to calculate lot sizes with precision. While there are many lot size calculators available on TradingView, I found that most had significant flaws. I started teaching myself Pine Script over three and a half years ago with the sole purpose of building this tool. My first version was messy and lacked accuracy, so I never published it. I wanted it to be better than any other available tool, but my limited knowledge back then held me back.
Recently, I received a request to create a similar tool, as the current options still fail to deliver the precision and reliability traders need. This inspired me to revisit my original idea. With improved skills and a better understanding of Pine Script, I redesigned the tool from scratch, making it as precise, reliable, and efficient as possible.
This tool features built-in error detection to minimize mistakes and ensure accuracy in lot size calculations. I've spent more time on this project than on any other, focusing on delivering a solution that stands out on TradingView. While I plan to add more features based on user feedback, the current version is already a powerful, dependable, and easy-to-use tool for traders who value precision and efficiency in their lot size calculations.
How to use the tool ?
At first it might seem complicated, but it is quite easy to use the tool. There are two modes: auto and manual. By default, the tool is set on manual mode. When you apply the tool on the chart, it will ask you to choose the entry price, then the stop-loss price, and at last the take-profit price. Select all of them one by one. These values can be changed later.
Settings
There are various setting given for making the tool as flexible as possible. Here is the explanation for some of most important settings. Play with them and make yourself comfortable.
General settings
Auto mode : Use this mode if you want the the risk reward to be fixed and stop loss to be based on ATR. However the stop loss can be changed to be based on user input.
Manual mode : Use this mode if you want full control over entry, stop loss and take profit.
Contract Size : The tool works perfectly for all forex pairs including gold and silver but as the contract size is different for different assets it is difficult to add every single asset into the script manually so i have provided this option. In case you want to calculate lot size for a asset other then forex, gold or silver make sure to change this. Contract size = Quantity of the asset in 1 standerd lot.
Account settings
Automatic mode settings and ATR stop settings
Manual mode settings
Table and risk-reward box settings are pretty much self-explanatory i guess.
Error handling
A lot size calculator is a complex program. There are numerous points where it may fail and produce incorrect results. To make it robust and accurate, these issues must be addressed and managed properly, which practically all existing lot size calculator scripts fail to do.
Golden tip
When the symbol is changed it will display a symbol change warning as the entry, stop loss and take profit price won't change.
There are 2 ways to get fix this. Either manually enter all three values which i hate the most or remove the script from the chart and re-apply the script on chart again.
So to re-apply the indicator in most easy way follow the following instructions:
Note : If you encounter any other error then read the instruction to fix it and if it is an unknow error pleas report it to me in comments or DM.
Cari dalam skrip untuk "take profit"
ICT NY Kill Zone Auto Trading### **ICT NY Kill Zone Auto Trading Strategy (5-Min Chart)**
#### **Overview:**
This strategy is based on Inner Circle Trader (ICT) concepts, focusing on the **New York Kill Zone**. It is designed for trading GBP/USD exclusively on the **5-minute chart**, automatically entering and exiting trades during the US session.
#### **Key Components:**
1. **Time Filter**
- The strategy only operates during the **New York Kill Zone (9:30 AM - 11:00 AM NY Time)**.
- It ensures execution only on the **5-minute timeframe**.
2. **Fair Value Gaps (FVGs) Detection**
- The script identifies areas where price action left an imbalance, known as Fair Value Gaps (FVGs).
- These gaps indicate potential liquidity zones where price may return before continuing in the original direction.
3. **Order Blocks (OBs) Identification**
- **Bullish Order Block:** Occurs when price forms a strong bullish pattern, suggesting further upside movement.
- **Bearish Order Block:** Identified when a strong bearish formation signals potential downside continuation.
4. **Trade Execution**
- **Long Trade:** Entered when a bullish order block forms within the NY Kill Zone and aligns with an FVG.
- **Short Trade:** Entered when a bearish order block forms within the Kill Zone and aligns with an FVG.
5. **Risk Management**
- **Stop Loss:** Fixed at **30 pips** to limit downside risk.
- **Take Profit:** Set at **60 pips**, providing a **2:1 risk-reward ratio**.
6. **Visual Aids**
- The **Kill Zone is highlighted in blue** to help traders visually confirm the active session.
**Objective:**
This script aims to **capitalize on institutional price movements** within the New York session by leveraging ICT concepts such as FVGs and Order Blocks. By automating trade entries and exits, it eliminates emotions and ensures a disciplined trading approach.

Bollinger Bounce Reversal Strategy – Visual EditionOverview:
The Bollinger Bounce Reversal Strategy – Visual Edition is designed to capture potential reversal moves at price extremes—often termed “bounce points”—by using a combination of technical indicators. The strategy integrates Bollinger Bands, MACD, and volume analysis, and it provides rich on‑chart visual cues to help traders understand its signals and conditions. Additionally, the strategy enforces a maximum of 5 trades per day and uses fixed risk management parameters. This publication is intended for educational purposes and offers a systematic, transparent approach that you can further adjust to fit your market or risk profile.
How It Works:
Bollinger Bands:
A 20‑period simple moving average (SMA) and a user‑defined standard deviation multiplier (default 2.0) are used to calculate the Bollinger Bands.
When the price reaches or crosses these bands (i.e. falls below the lower band or rises above the upper band), it suggests that the price is in an extreme, potentially oversold or overbought, state.
MACD Filter:
The MACD (calculated with standard lengths, e.g. 12, 26, 9) provides momentum information.
For a bullish (long) signal, the MACD line should be above its signal line; for a bearish (short) signal, the MACD line should be below.
Volume Confirmation:
The strategy uses a 20‑period volume moving average to determine if current volume is strong enough to validate a signal.
A signal is confirmed only if the current volume is at or above a specified multiple (by default, 1.0×) of this moving average, ensuring that the move is supported by increased market participation.
Visual Cues:
Bollinger Bands and Fill: The basis (SMA), upper, and lower Bollinger Bands are plotted, and the area between the upper and lower bands is filled with a semi‑transparent color.
Signal Markers: When a long or short signal is generated, corresponding markers (labels) appear on the chart.
Background Coloring: The chart’s background changes color (green for long signals and red for short signals) on the bars where signals occur.
Information Table: An on‑chart table displays key indicator values (MACD, signal line, volume, average volume) and the number of trades executed that day.
Entry Conditions:
Long Entry:
A long trade is triggered when the previous bar’s close is below the lower Bollinger Band and the current bar’s close crosses above it, combined with a bullish MACD condition and strong volume.
Short Entry:
A short trade is triggered when the previous bar’s close is above the upper Bollinger Band and the current bar’s close crosses below it, with a bearish MACD condition and high volume.
Risk Management:
Daily Trade Limit: The strategy restricts trading to no more than 5 trades per day.
Stop-Loss and Take-Profit:
For each position, a stop loss is set at a fixed percentage away from the entry price (typically 2%), and a take profit is set to target a 1:2 risk-reward ratio (typically 4% from the entry price).
Backtesting Setup:
Initial Capital: $10,000
Commission: 0.1% per trade
Slippage: 1 tick per bar
These realistic parameters help ensure that backtesting results reflect the conditions of an average trader.
Disclaimer:
Past performance is not indicative of future results. This strategy is experimental and provided solely for educational purposes. It is essential to backtest extensively and paper trade before any live deployment. All risk management practices are advisory, and you should adjust parameters to suit your own trading style and risk tolerance.
Conclusion:
By combining Bollinger Bands, MACD, and volume analysis, the Bollinger Bounce Reversal Strategy – Visual Edition provides a clear, systematic method to identify potential reversal opportunities at price extremes. The added visual cues help traders quickly interpret signals and assess market conditions, while strict risk management and a daily trade cap help keep trading disciplined. Adjust and refine the settings as needed to better suit your specific market and risk profile.

EMA Crossover Backtest [BarScripts]This indicator lets you backtest an EMA crossover strategy with built-in risk management and trade tracking. It simulates long and short trades based on EMA crossovers, allowing you to fine-tune entry conditions, stop-loss placement, and reward/risk settings.
🔹 How It Works:
Long Entry: Fast EMA crosses above Slow EMA, and price closes above Fast EMA.
Short Entry: Fast EMA crosses below Slow EMA, and price closes below Fast EMA.
Stop Loss: Set based on previous bars or a fixed amount.
Take Profit: Adjustable reward/risk ratio.
Higher Timeframe Confluence: Confirms trades based on a larger timeframe.
Trade Hours Filter: Limits trades to specific time windows.
🔹 Key Features:
✅ Shows Entry & Exit Points with visual trade lines.
✅ Customizable EMA Lengths to fit any strategy.
✅ P&L Tracking & Statistics to measure performance.
✅ Position Sizing Options: Fixed position, fixed risk, or percentage of balance.
✅ Commissions Tracking (based on total trades, not contracts).
Use this tool to fine-tune your EMA crossover strategy and see how it performs over time! 🚀
💬 Let me know your feedback—suggest improvements, report issues, or request new features!

Volatility Momentum Breakout StrategyDescription:
Overview:
The Volatility Momentum Breakout Strategy is designed to capture significant price moves by combining a volatility breakout approach with trend and momentum filters. This strategy dynamically calculates breakout levels based on market volatility and uses these levels along with trend and momentum conditions to identify trade opportunities.
How It Works:
1. Volatility Breakout:
• Methodology:
The strategy computes the highest high and lowest low over a defined lookback period (excluding the current bar to avoid look-ahead bias). A multiple of the Average True Range (ATR) is then added to (or subtracted from) these levels to form dynamic breakout thresholds.
• Purpose:
This method helps capture significant price movements (breakouts) while ensuring that only past data is used, thereby maintaining realistic signal generation.
2. Trend Filtering:
• Methodology:
A short-term Exponential Moving Average (EMA) is applied to determine the prevailing trend.
• Purpose:
Long trades are considered only when the current price is above the EMA, indicating an uptrend, while short trades are taken only when the price is below the EMA, indicating a downtrend.
3. Momentum Confirmation:
• Methodology:
The Relative Strength Index (RSI) is used to gauge market momentum.
• Purpose:
For long entries, the RSI must be above a mid-level (e.g., above 50) to confirm upward momentum, and for short entries, it must be below a similar threshold. This helps filter out signals during overextended conditions.
Entry Conditions:
• Long Entry:
A long position is triggered when the current closing price exceeds the calculated long breakout level, the price is above the short-term EMA, and the RSI confirms momentum (e.g., above 50).
• Short Entry:
A short position is triggered when the closing price falls below the calculated short breakout level, the price is below the EMA, and the RSI confirms momentum (e.g., below 50).
Risk Management:
• Position Sizing:
Trades are sized to risk a fixed percentage of account equity (set here to 5% per trade in the code, with each trade’s stop loss defined so that risk is limited to approximately 2% of the entry price).
• Stop Loss & Take Profit:
A stop loss is placed a fixed ATR multiple away from the entry price, and a take profit target is set to achieve a 1:2 risk-reward ratio.
• Realistic Backtesting:
The strategy is backtested using an initial capital of $10,000, with a commission of 0.1% per trade and slippage of 1 tick per bar—parameters chosen to reflect conditions faced by the average trader.
Important Disclaimers:
• No Look-Ahead Bias:
All breakout levels are calculated using only past data (excluding the current bar) to ensure that the strategy does not “peek” into future data.
• Educational Purpose:
This strategy is experimental and provided solely for educational purposes. Past performance is not indicative of future results.
• User Responsibility:
Traders should thoroughly backtest and paper trade the strategy under various market conditions and adjust parameters to fit their own risk tolerance and trading style before live deployment.
Conclusion:
By integrating volatility-based breakout signals with trend and momentum filters, the Volatility Momentum Breakout Strategy offers a unique method to capture significant price moves in a disciplined manner. This publication provides a transparent explanation of the strategy’s components and realistic backtesting parameters, making it a useful tool for educational purposes and further customization by the TradingView community.

Arpeet MACDOverview
This strategy is based on the zero-lag version of the MACD (Moving Average Convergence Divergence) indicator, which captures short-term trends by quickly responding to price changes, enabling high-frequency trading. The strategy uses two moving averages with different periods (fast and slow lines) to construct the MACD indicator and introduces a zero-lag algorithm to eliminate the delay between the indicator and the price, improving the timeliness of signals. Additionally, the crossover of the signal line and the MACD line is used as buy and sell signals, and alerts are set up to help traders seize trading opportunities in a timely manner.
Strategy Principle
Calculate the EMA (Exponential Moving Average) or SMA (Simple Moving Average) of the fast line (default 12 periods) and slow line (default 26 periods).
Use the zero-lag algorithm to double-smooth the fast and slow lines, eliminating the delay between the indicator and the price.
The MACD line is formed by the difference between the zero-lag fast line and the zero-lag slow line.
The signal line is formed by the EMA (default 9 periods) or SMA of the MACD line.
The MACD histogram is formed by the difference between the MACD line and the signal line, with blue representing positive values and red representing negative values.
When the MACD line crosses the signal line from below and the crossover point is below the zero axis, a buy signal (blue dot) is generated.
When the MACD line crosses the signal line from above and the crossover point is above the zero axis, a sell signal (red dot) is generated.
The strategy automatically places orders based on the buy and sell signals and triggers corresponding alerts.
Advantage Analysis
The zero-lag algorithm effectively eliminates the delay between the indicator and the price, improving the timeliness and accuracy of signals.
The design of dual moving averages can better capture market trends and adapt to different market environments.
The MACD histogram intuitively reflects the comparison of bullish and bearish forces, assisting in trading decisions.
The automatic order placement and alert functions make it convenient for traders to seize trading opportunities in a timely manner, improving trading efficiency.
Risk Analysis
In volatile markets, frequent crossover signals may lead to overtrading and losses.
Improper parameter settings may cause signal distortion and affect strategy performance.
The strategy relies on historical data for calculations and has poor adaptability to sudden events and black swan events.
Optimization Direction
Introduce trend confirmation indicators, such as ADX, to filter out false signals in volatile markets.
Optimize parameters to find the best combination of fast and slow line periods and signal line periods, improving strategy stability.
Combine other technical indicators or fundamental factors to construct a multi-factor model, improving risk-adjusted returns of the strategy.
Introduce stop-loss and take-profit mechanisms to control single-trade risk.
Summary
The MACD Dual Crossover Zero Lag Trading Strategy achieves high-frequency trading by quickly responding to price changes and capturing short-term trends. The zero-lag algorithm and dual moving average design improve the timeliness and accuracy of signals. The strategy has certain advantages, such as intuitive signals and convenient operation, but also faces risks such as overtrading and parameter sensitivity. In the future, the strategy can be optimized by introducing trend confirmation indicators, parameter optimization, multi-factor models, etc., to improve the robustness and profitability of the strategy.

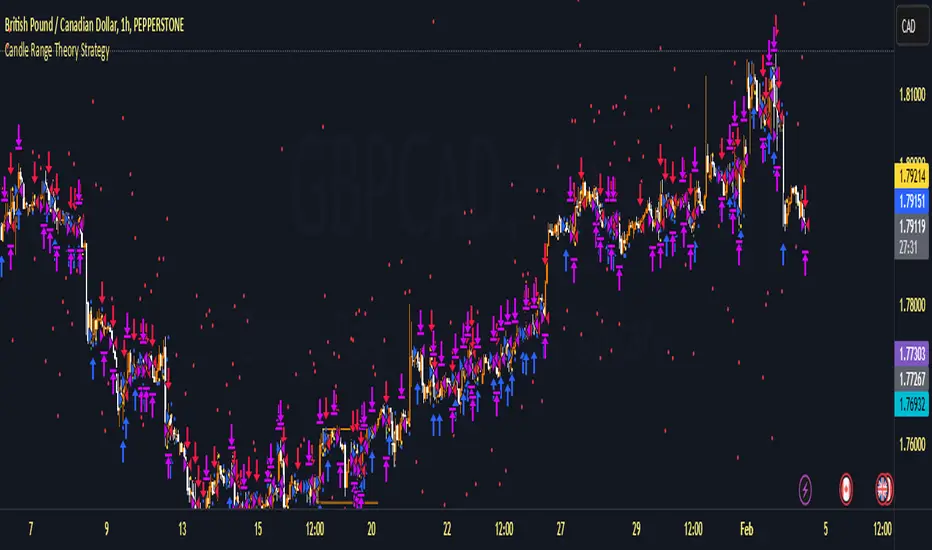
Candle Range Theory StrategyCandle Range Theory StrategyCandle Range Theory Strategy delves into the intricacies of price action analysis, focusing on the behavior of candlestick patterns within specific ranges. Traders employing this strategy aim to identify key support and resistance levels by analyzing the high and low points of significant candlesticks. The core principle lies in understanding that the range of a candle—defined by its opening, closing, high, and low prices—provides valuable insight into market sentiment and potential future movements.
To implement the Candle Range Theory Strategy effectively, one must first recognize the importance of different candle sizes. A long-bodied candle suggests strong momentum, pointing to a bullish or bearish bias, while a small-bodied candle indicates indecision or consolidation, often signaling potential reversals or breakouts. By plotting these candlesticks over a defined time frame, traders can ascertain whether the market is trending or range-bound.
Additionally, traders should consider the context in which these candles form. Analysis of the preceding price action can reveal whether current ranges are extensions of existing trends or indications of market fatigue. In particular, look for patterns such as engulfing candles, pin bars, or inside bars, as they often foreshadow forthcoming price fluctuations.
Moreover, combining the Candle Range Theory with other technical indicators, like moving averages or Fibonacci retracements, can offer a more comprehensive view of potential entry and exit points. By aligning candle patterns with broader market dynamics, traders can optimize their strategies, enhancing their probability of success while minimizing risk.
Lastly, maintaining a disciplined approach is crucial. Setting precise stop-loss and take-profit levels grounded in candle ranges can safeguard one's capital. Adhering to this framework allows traders to navigate the complexities of the market with greater confidence, ultimately leading to more informed and successful trading decisions. Embracing the nuances of Candle Range Theory not only sharpens analytical skills but also enriches one’s trading repertoire, paving the way for sustained profitability in the dynamic world of forex and equities.
Daily COC Strategy with SHERLOCK WAVESThis indicator implements a unique trading strategy known as the "Daily COC (Candle Over Candle) Strategy" enhanced with "SHERLOCK WAVES" for pattern recognition. It's designed for traders looking to capitalize on specific candlestick formations with a negative risk-reward ratio, with the aim of achieving a high win rate (over 70%) through numerous trading opportunities, despite each trade having a higher risk relative to the reward.
Key Features:
Pattern Recognition: Identifies a setup based on three consecutive candles - a red candle followed by a shooting star, then an entry candle that does not break below the shooting star's low.
Negative Risk/Reward Trade Selection: Focuses on entries where the potential stop loss is greater than the take profit, banking on a high win rate to offset the individual trade's negative risk-reward ratio.
Visual Signals:
Green Label: Marks potential entry points at the high of the candle before the entry.
Green Dot: Indicates a winning trade closure.
Red Dot: Signals a losing trade closure.
Blue Circle: Warns when the current candle is within 2% of breaking above the previous candle's high, suggesting a potential setup is developing.
Green Circle: Plots the take profit level.
Red Circle: Plots the stop loss level.
Dynamic Statistics: A live updating label showing the number of trades, wins, losses, open trades, current account balance, and win percentage.
Customizable Parameters:
Risk % per Trade: Adjust the percentage of your account balance you're willing to risk on each trade.
Initial Account Balance: Set your starting balance for tracking performance.
Start Date for Strategy: Define when the strategy should start calculating from, allowing for backtesting.
Alerts:
An alert condition is set for when a potential trade setup is developing, helping traders prepare for entries.
Usage Tips:
This strategy is predicated on the idea that a high win rate can compensate for the negative risk-reward ratio of individual trades. It might not suit all market conditions or traders' risk profiles.
Use this strategy in conjunction with other analysis methods to validate trade setups.
Note: Always backtest thoroughly before applying to live markets. Consider this tool as part of a broader trading strategy, not a standalone solution. Monitor your win rate and adjust your risk management accordingly to ensure the strategy remains profitable over time.
This description now correctly explains the purpose behind the negative risk-reward ratio in the context of your trading strategy.

Trend & ADX by Gideon for Indian MarketsThis indicator is designed to help traders **identify strong trends** using the **Kalman Filter** and **ADX** (Average Directional Index). It provides **Buy/Sell signals** based on trend direction and ADX strength. I wanted to create something for Indian markets since there are not much available.
In a nut-shell:
✅ **Buy when the Kalman Filter turns green, and ADX is strong.
❌ **Sell when the Kalman Filter turns red, and ADX is strong.
📌 **Ignore signals if ADX is weak (below threshold).
📊 Use on 5-minute timeframes for intraday trading.
------------------------------------------------------------------------
1. Understanding the Indicator Components**
- **Green Line:** Indicates an **uptrend**.
- **Red Line:** Indicates a **downtrend**.
- The **line color change** signals a potential **trend reversal**.
**ADX Strength Filter**
- The **ADX (orange line)** measures trend strength.
- The **blue horizontal line** marks the **ADX threshold** (default: 20).
- A **Buy/Sell signal is only valid if ADX is above the threshold**, ensuring a strong trend.
**Buy & Sell Signals**
- **Buy Signal (Green Up Arrow)**
- Appears **one candle before** the Kalman line turns green.
- ADX must be **above the threshold** (default: 20).
- Suggests entering a **long position**.
- **Sell Signal (Red Down Arrow)**
- Appears **one candle before** the Kalman line turns red.
- ADX must be **above the threshold** (default: 20).
- Suggests entering a **short position**.
2. Best Settings for 5-Minute Timeframe**
For day trading on the **5-minute chart**, the following settings work best:
- **Kalman Filter Length:** `50`
- **Process Noise (Q):** `0.1`
- **Measurement Noise (R):** `0.01`
- **ADX Length:** `14`
- **ADX Threshold:** `20`
- **(Increase to 25-30 for more reliable signals in volatile markets)**
3. How to Trade with This Indicator**
**Entry Rules**
✅ **Buy Entry**
- Wait for a **green arrow (Buy Signal).
- Kalman Line must **turn green**.
- ADX must be **above the threshold** (strong trend confirmed).
- Enter a **long position** on the next candle.
❌ **Sell Entry**
- Wait for a **red arrow (Sell Signal).
- Kalman Line must **turn red**.
- ADX must be **above the threshold** (strong trend confirmed).
- Enter a **short position** on the next candle.
**Exit & Risk Management**
📌 **Stop Loss**:
- Place stop-loss **below the previous swing low** (for buys) or **above the previous swing high** (for sells).
📌 **Take Profit:
- Use a **Risk:Reward Ratio of 1:2 or 1:3.
- Exit when the **Kalman Filter color changes** (opposite trend signal).
📌 **Avoid Weak Trends**:
- **No trades when ADX is below the threshold** (low trend strength).
4. Additional Tips
- Works best on **liquid assets** like **Bank Nifty, Nifty 50, and large-cap stocks**.
- **Avoid ranging markets** with low ADX values (<20).
- Use alongside **volume analysis and support/resistance levels** for confirmation.
- Experiment with **ADX Threshold (increase for stronger signals, decrease for more trades).**
Best of Luck traders ! 🚀

Johnny's Machine Learning Moving Average (MLMA) w/ Trend Alerts📖 Overview
Johnny's Machine Learning Moving Average (MLMA) w/ Trend Alerts is a powerful adaptive moving average indicator designed to capture market trends dynamically. Unlike traditional moving averages (e.g., SMA, EMA, WMA), this indicator incorporates volatility-based trend detection, Bollinger Bands, ADX, and RSI, offering a comprehensive view of market conditions.
The MLMA is "machine learning-inspired" because it adapts dynamically to market conditions using ATR-based windowing and integrates multiple trend strength indicators (ADX, RSI, and volatility bands) to provide an intelligent moving average calculation that learns from recent price action rather than being static.
🛠 How It Works
1️⃣ Adaptive Moving Average Selection
The MLMA automatically selects one of four different moving averages:
📊 EMA (Exponential Moving Average) – Reacts quickly to price changes.
🔵 HMA (Hull Moving Average) – Smooth and fast, reducing lag.
🟡 WMA (Weighted Moving Average) – Gives recent prices more importance.
🔴 VWAP (Volume Weighted Average Price) – Accounts for volume impact.
The user can select which moving average type to use, making the indicator customizable based on their strategy.
2️⃣ Dynamic Trend Detection
ATR-Based Adaptive Window 📏
The Average True Range (ATR) determines the window size dynamically.
When volatility is high, the moving average window expands, making the MLMA more stable.
When volatility is low, the window shrinks, making the MLMA more responsive.
Trend Strength Filters 📊
ADX (Average Directional Index) > 25 → Indicates a strong trend.
RSI (Relative Strength Index) > 70 or < 30 → Identifies overbought/oversold conditions.
Price Position Relative to Upper/Lower Bands → Determines bullish vs. bearish momentum.
3️⃣ Volatility Bands & Dynamic Support/Resistance
Bollinger Bands (BB) 📉
Uses standard deviation-based bands around the MLMA to detect overbought and oversold zones.
Upper Band = Resistance, Lower Band = Support.
Helps traders identify breakout potential.
Adaptive Trend Bands 🔵🔴
The MLMA has built-in trend envelopes.
When price breaks the upper band, bullish momentum is confirmed.
When price breaks the lower band, bearish momentum is confirmed.
4️⃣ Visual Enhancements
Dynamic Gradient Fills 🌈
The trend strength (ADX-based) determines the gradient intensity.
Stronger trends = More vivid colors.
Weaker trends = Lighter colors.
Trend Reversal Arrows 🔄
🔼 Green Up Arrow: Bullish reversal signal.
🔽 Red Down Arrow: Bearish reversal signal.
Trend Table Overlay 🖥
Displays ADX, RSI, and Trend State dynamically on the chart.
📢 Trading Signals & How to Use It
1️⃣ Bullish Signals 📈
✅ Conditions for a Long (Buy) Trade:
The MLMA crosses above the lower band.
The ADX is above 25 (confirming trend strength).
RSI is above 55, indicating positive momentum.
Green trend reversal arrow appears (confirmation of a bullish reversal).
🔹 How to Trade It:
Enter a long trade when the MLMA turns bullish.
Set stop-loss below the lower Bollinger Band.
Target previous resistance levels or use the upper band as take-profit.
2️⃣ Bearish Signals 📉
✅ Conditions for a Short (Sell) Trade:
The MLMA crosses below the upper band.
The ADX is above 25 (confirming trend strength).
RSI is below 45, indicating bearish pressure.
Red trend reversal arrow appears (confirmation of a bearish reversal).
🔹 How to Trade It:
Enter a short trade when the MLMA turns bearish.
Set stop-loss above the upper Bollinger Band.
Target the lower band as take-profit.
💡 What Makes This a Machine Learning Moving Average?
📍 1️⃣ Adaptive & Self-Tuning
Unlike static moving averages that rely on fixed parameters, this MLMA automatically adjusts its sensitivity to market conditions using:
ATR-based dynamic windowing 📏 (Expands/contracts based on volatility).
Adaptive smoothing using EMA, HMA, WMA, or VWAP 📊.
Multi-indicator confirmation (ADX, RSI, Volatility Bands) 🏆.
📍 2️⃣ Intelligent Trend Confirmation
The MLMA "learns" from recent price movements instead of blindly following a fixed-length average.
It incorporates ADX & RSI trend filtering to reduce noise & false signals.
📍 3️⃣ Dynamic Color-Coding for Trend Strength
Strong trends trigger more vivid colors, mimicking confidence levels in machine learning models.
Weaker trends appear faded, suggesting uncertainty.
🎯 Why Use the MLMA?
✅ Pros
✔ Combines multiple trend indicators (MA, ADX, RSI, BB).
✔ Automatically adjusts to market conditions.
✔ Filters out weak trends, making it more reliable.
✔ Visually intuitive (gradient colors & reversal arrows).
✔ Works across all timeframes and assets.
⚠️ Cons
❌ Not a standalone strategy → Best used with volume confirmation or candlestick analysis.
❌ Can lag slightly in fast-moving markets (due to smoothing).

IU Range Trading StrategyIU Range Trading Strategy
The IU Range Trading Strategy is designed to identify range-bound markets and take trades based on defined price ranges. This strategy uses a combination of price ranges and ATR (Average True Range) to filter entry conditions and incorporates a trailing stop-loss mechanism for better trade management.
User Inputs:
- Range Length: Defines the number of bars to calculate the highest and lowest price range (default: 10).
- ATR Length: Sets the length of the ATR calculation (default: 14).
- ATR Stop-Loss Factor: Determines the multiplier for the ATR-based stop-loss (default: 2.00).
Entry Conditions:
1. A range is identified when the difference between the highest and lowest prices over the selected range is less than or equal to 1.75 times the ATR.
2. Once a valid range is formed:
- A long trade is triggered at the range high.
- A short trade is triggered at the range low.
Exit Conditions:
1. Trailing Stop-Loss:
- The stop-loss adjusts dynamically using ATR targets.
- The strategy locks in profits as the trade moves in your favor.
2. The stop-loss and take-profit levels are visually plotted for transparency and easier decision-making.
Features:
- Automated box creation to visualize the trading range.
- Supports one position at a time, canceling opposite-side entries.
- ATR-based trailing stop-loss for effective risk management.
- Clear visual representation of stop-loss and take-profit levels with colored bands.
This strategy works best in markets with defined ranges and can help traders identify breakout opportunities when the price exits the range.

Adaptive Fractal Grid Scalping StrategyThis Pine Script v6 component implements an "Adaptive Fractal Grid Scalping Strategy" with an added volatility threshold feature.
Here's how it works:
Fractal Break Detection: Uses ta.pivothigh and ta.pivotlow to identify local highs and lows.
Volatility Clustering: Measures volatility using the Average True Range (ATR).
Adaptive Grid Levels: Dynamically adjusts grid levels based on ATR and user-defined multipliers.
Directional Bias Filter: Uses a Simple Moving Average (SMA) to determine trend direction.
Volatility Threshold: Introduces a new input to specify a minimum ATR value required to activate the strategy.
Trade Execution Logic: Places limit orders at grid levels based on trend direction and fractal levels, but only when ATR exceeds the volatility threshold.
Profit-Taking and Stop-Loss: Implements profit-taking at grid levels and a trailing stop-loss based on ATR.
How to Use
Inputs: Customize the ATR length, SMA length, grid multipliers, trailing stop multiplier, and volatility threshold through the input settings.
Visuals: The script plots fractal points and grid levels on the chart for easy visualization.
Trade Signals: The strategy automatically places buy/sell orders based on the detected fractals, trend direction, and volatility threshold.
Profit and Risk Management: The script includes logic for taking profits and setting stop-loss levels to manage trades effectively.
This strategy is designed to capitalize on micro-movements during high volatility and avoid overtrading during low-volatility trends. Adjust the input parameters to suit your trading style and market conditions.

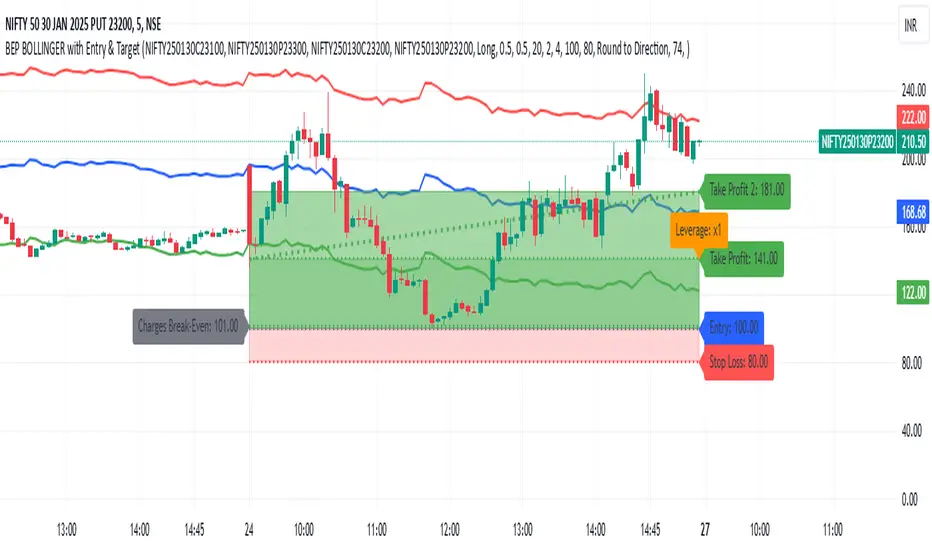
BEP BOLLINGER with Entry & TargetBEP BOLLINGER with Entry & Target Indicator
INPUT
ITM CE
ITM PE
ATM CE
ATM PE
This custom Pine Script indicator provides traders with a powerful tool to analyze options trading setups, specifically for Call and Put options (CE & PE). By integrating Bollinger Bands with a set of configurable parameters, it calculates key entry, stop loss, and take profit levels, while factoring in risk and reward for each trade. Ideal for options traders, this indicator supports precise risk management and enhances your ability to plan and execute trades based on calculated entry points and profit targets.
Key Features:
CE & PE Symbol Selection: Allows users to input two pairs of Call and Put option symbols for premium calculation.
Premium Calculation: Automatically calculates and plots the average premium for each pair of options.
Risk & Reward Zones: Visualizes risk zones and reward zones based on user-defined entry price, stop loss, and risk/reward ratio.
Leverage and Stop Loss Calculation: Computes the optimal leverage and adjusts stop loss based on acceptable loss percentage.
Break-Even Point: Identifies the break-even point considering trading fees and leverage.
Take Profit Levels: Calculates and visualizes multiple take profit levels with different risk/reward ratios.
Multi-Timeframe Analysis: Incorporates higher timeframe analysis to determine entry and stop loss levels for better decision-making.
Dynamic Alerts: Provides alerts when the price hits the stop loss, take profit levels, or reaches the break-even point.
Visual Tools: Draws lines and shaded areas for entry, stop loss, take profit, and risk/reward zones to aid in visual decision-making.
Customizable Settings:
Risk Management: Adjust stop loss, leverage, and risk/reward ratios to suit your trading strategy.
Trading Direction: Choose between Long or Short positions based on market outlook.
Fee Calculations: Input your buy and sell fees to accurately calculate break-even and profit zones.
Color Customization: Personalize the color of premium lines, offset levels, and risk/reward zones.
Alerts:
Alerts can be set for Stop Loss, Take Profit, and Break-Even, ensuring you're notified in real-time when important price levels are reached.
This tool is perfect for traders looking to integrate risk management and precise trade setup analysis into their options trading strategy.
200 EMA Breakout & Retest Strategy200 EMA Breakout & Retest Strategy
This script is designed for traders who rely on the 200 EMA as a key indicator for trend direction and trade setups. The strategy identifies potential buy and sell opportunities based on breakouts and subsequent retests of the 200 EMA.
How It Works
EMA Breakout Detection:
The script monitors when the price crosses and closes above or below the 200 EMA.
No signal is generated immediately upon the breakout.
Retest Confirmation:
After the breakout, the price must retrace to touch the 200 EMA.
A valid signal occurs only when the price touches the EMA and the candle closes above (for buy) or below (for sell).
Trade Signal Generation:
Once the retest is confirmed:
A Buy Signal is generated if the price closes above the 200 EMA after the retest.
A Sell Signal is generated if the price closes below the 200 EMA after the retest.
The script calculates:
Stop Loss: Placed at the low of the candle for a buy signal and at the high of the candle for a sell signal.
Take Profit: Based on a customizable Risk-Reward Ratio (default is 1:2).
Visual Indicators:
The 200 EMA is plotted on the chart for reference.
Buy/Sell signals are displayed as labels on the chart.
Stop loss and take profit levels are drawn using dotted lines.
Customization Options
EMA Length: Adjustable (default is 200).
Risk-Reward Ratio: Customizable to suit different trading styles.
Who Is This For?
This strategy is ideal for traders who:
Prefer trading with the trend using EMA-based strategies.
Look for precise entry points with confirmation from retests.
Require automated calculation of risk-reward levels.

Sunil BB Blast Heikin Ashi StrategySunil BB Blast Heikin Ashi Strategy
The Sunil BB Blast Heikin Ashi Strategy is a trend-following trading strategy that combines Bollinger Bands with Heikin-Ashi candles for precise market entries and exits. It aims to capitalize on price volatility while ensuring controlled risk through dynamic stop-loss and take-profit levels based on a user-defined Risk-to-Reward Ratio (RRR).
Key Features:
Trading Window:
The strategy operates within a user-defined time window (e.g., from 09:20 to 15:00) to align with market hours or other preferred trading sessions.
Trade Direction:
Users can select between Long Only, Short Only, or Long/Short trade directions, allowing flexibility depending on market conditions.
Bollinger Bands:
Bollinger Bands are used to identify potential breakout or breakdown zones. The strategy enters trades when price breaks through the upper or lower Bollinger Band, indicating a possible trend continuation.
Heikin-Ashi Candles:
Heikin-Ashi candles help smooth price action and filter out market noise. The strategy uses these candles to confirm trend direction and improve entry accuracy.
Risk Management (Risk-to-Reward Ratio):
The strategy automatically adjusts the take-profit (TP) level and stop-loss (SL) based on the selected Risk-to-Reward Ratio (RRR). This ensures that trades are risk-managed effectively.
Automated Alerts and Webhooks:
The strategy includes automated alerts for trade entries and exits. Users can set up JSON webhooks for external execution or trading automation.
Active Position Tracking:
The strategy tracks whether there is an active position (long or short) and only exits when price hits the pre-defined SL or TP levels.
Exit Conditions:
The strategy exits positions when either the take-profit (TP) or stop-loss (SL) levels are hit, ensuring risk management is adhered to.
Default Settings:
Trading Window:
09:20-15:00
This setting confines the strategy to the specified hours, ensuring trading only occurs during active market hours.
Strategy Direction:
Default: Long/Short
This allows for both long and short trades depending on market conditions. You can select "Long Only" or "Short Only" if you prefer to trade in one direction.
Bollinger Band Length (bbLength):
Default: 19
Length of the moving average used to calculate the Bollinger Bands.
Bollinger Band Multiplier (bbMultiplier):
Default: 2.0
Multiplier used to calculate the upper and lower bands. A higher multiplier increases the width of the bands, leading to fewer but more significant trades.
Take Profit Multiplier (tpMultiplier):
Default: 2.0
Multiplier used to determine the take-profit level based on the calculated stop-loss. This ensures that the profit target aligns with the selected Risk-to-Reward Ratio.
Risk-to-Reward Ratio (RRR):
Default: 1.0
The ratio used to calculate the take-profit relative to the stop-loss. A higher RRR means larger profit targets.
Trade Automation (JSON Webhooks):
Allows for integration with external systems for automated execution:
Long Entry JSON: Customizable entry condition for long positions.
Long Exit JSON: Customizable exit condition for long positions.
Short Entry JSON: Customizable entry condition for short positions.
Short Exit JSON: Customizable exit condition for short positions.
Entry Logic:
Long Entry:
The strategy enters a long position when:
The Heikin-Ashi candle shows a bullish trend (green close > open).
The price is above the upper Bollinger Band, signaling a breakout.
The previous candle also closed higher than it opened.
Short Entry:
The strategy enters a short position when:
The Heikin-Ashi candle shows a bearish trend (red close < open).
The price is below the lower Bollinger Band, signaling a breakdown.
The previous candle also closed lower than it opened.
Exit Logic:
Take-Profit (TP):
The take-profit level is calculated as a multiple of the distance between the entry price and the stop-loss level, determined by the selected Risk-to-Reward Ratio (RRR).
Stop-Loss (SL):
The stop-loss is placed at the opposite Bollinger Band level (lower for long positions, upper for short positions).
Exit Trigger:
The strategy exits a trade when either the take-profit or stop-loss level is hit.
Plotting and Visuals:
The Heikin-Ashi candles are displayed on the chart, with green candles for uptrends and red candles for downtrends.
Bollinger Bands (upper, lower, and basis) are plotted for visual reference.
Entry points for long and short trades are marked with green and red labels below and above bars, respectively.
Strategy Alerts:
Alerts are triggered when:
A long entry condition is met.
A short entry condition is met.
A trade exits (either via take-profit or stop-loss).
These alerts can be used to trigger notifications or webhook events for automated trading systems.
Notes:
The strategy is designed for use on intraday charts but can be applied to any timeframe.
It is highly customizable, allowing for tailored risk management and trading windows.
The Sunil BB Blast Heikin Ashi Strategy combines two powerful technical analysis tools (Bollinger Bands and Heikin-Ashi candles) with strong risk management, making it suitable for both beginners and experienced traders.
Feebacks are welcome from the users.

Fibonacci Trend [ChartPrime]Fibonacci Trend Indicator
This powerful indicator leverages supertrend analysis to detect market direction while overlaying dynamic Fibonacci levels to highlight potential support, resistance, and optimal trend entry zones. With its straightforward design, it is perfect for traders looking to simplify their workflow and enhance decision-making.
⯁ KEY FEATURES AND HOW TO USE
⯌ Supertrend Trend Identification :
The indicator uses a supertrend algorithm to identify market direction. It displays purple for downtrends and green for uptrends, ensuring quick and clear trend analysis.
⯌ Fibonacci Levels for Current Swings :
Automatically calculates Fibonacci retracement levels (0.236, 0.382, 0.618, 0.786) for the current swing leg.
- These levels act as key zones for potential support, resistance, and trend continuation.
- The high and low swing points are labeled with exact prices, ensuring clarity.
- If the swing range is insufficient (less than five times ATR), Fibonacci levels are not displayed, avoiding irrelevant data.
⯌ Extended Fibonacci Levels :
User-defined extensions project Fibonacci levels into the future, aiding traders in planning price targets or projecting key zones.
⯌ Optimal Trend Entry Zone :
A filled area between 0.618 and 0.786 levels visually highlights the optimal entry zone for trend continuation. This allows traders to refine their entry points during pullbacks.
⯌ Diagonal Trend Line :
A dashed diagonal line connects the swing high and low, visually confirming the range and trend strength of the current swing.
⯌ Visual Labels for Fibonacci Levels :
Each Fibonacci level is marked with a label displaying its value for quick reference.
⯁ HOW TRADERS CAN POTENTIALLY USE THIS TOOL
Fibonacci Retracements:
Use the Fibonacci retracement levels to find key support or resistance zones where the price may pull back before continuing its trend.
Example: Enter long trades when the price retraces to 0.618–0.786 levels in an uptrend.
Fibonacci Extensions:
Use Fibonacci extensions to project future price targets based on the current trend's swing leg. Levels like 127.2% and 161.8% are commonly used as profit-taking zones.
Reversal Identification:
Spot potential reversals by monitoring price reactions at key Fibonacci retracement levels (e.g., 0.236 or 0.382) or the swing high/low.
Optimal Trend Entries:
The filled zone between 0.618 and 0.786 is a statistically strong area for entering a position in the direction of the trend.
Example: Enter long positions during retracements to this range in an uptrend.
Risk Management:
Set stop-losses below key Fibonacci levels or the swing low/high, and take profits at extension levels, enhancing your trade management strategies.
⯁ CONCLUSION
The Fibonacci Trend Indicator is a straightforward yet effective tool for identifying trends and key Fibonacci levels. It simplifies analysis by integrating supertrend-based trend identification with Fibonacci retracements, extensions, and optimal entry zones. Whether you're a beginner or experienced trader, this indicator is an essential addition to your toolkit for trend trading, reversal spotting, and risk management.

Outside Bar Strategy % (Alessio)Outside Bar Strategy %
This strategy is based on identifying Outside Bars, which occur when the current bar's high is higher than the previous bar's high and its low is lower than the previous bar's low. The strategy enters trades in the direction of the Outside Bar, offering a powerful way to capture price moves following a strong price expansion.
Key Features:
Long and Short Entries: The strategy enters a Long trade when the Outside Bar closes bullish (current close > open), and a Short trade when the Outside Bar closes bearish (current close < open).
Customizable Entry Levels: The entry point is calculated based on a customizable percentage of the Outside Bar's range, allowing flexibility for traders to fine-tune their entries at 50% or 70% of the bar's range.
Stop Loss (SL) and Take Profit (TP):
Stop Loss (SL) is automatically placed at the Outside Bar's low for Long trades and at its high for Short trades.
Take Profit (TP) is calculated as a percentage of the Outside Bar's range, with customizable settings for take-profit levels.
Visual Indicators:
Entry, Stop Loss, and Take Profit levels are plotted as lines on the chart, with customizable colors and widths for easy identification.
Labels are placed on the chart to indicate whether the trade is Long or Short, positioned above or below the Outside Bar's candlestick.
Alerts: Users can enable alerts to receive notifications when a trade is triggered, including details such as entry points and stop loss levels.
Strategy Parameters:
Entry Percentage: Set the entry level as a percentage of the Outside Bar's range (e.g., 50%, 70%).
Take Profit Percentage: Customize the Take Profit level as a percentage of the Outside Bar's range.
Customizable Colors and Line Widths: Adjust the colors and thickness of the entry, stop loss, and take profit lines to fit your preferences.
Alerts: Enable alerts to be notified when a trade is executed or when the entry level is reached.
This strategy is ideal for traders who want to capitalize on significant price moves after a breakout, with clear risk management through Stop Loss and Take Profit levels. The customizable features make it suitable for various market conditions and trading styles.

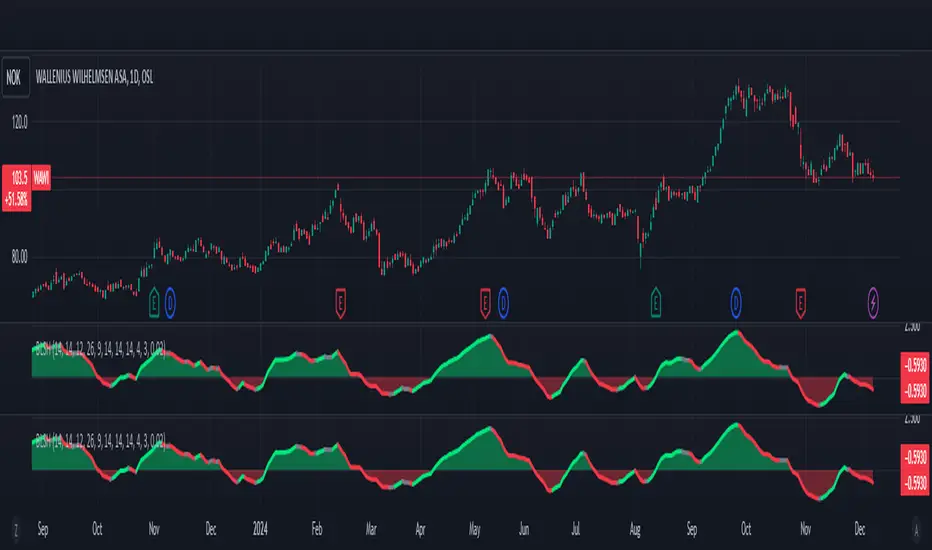
[blackat] L1 Funding Bottom Wave█ OVERVIEW
The script "Funding Bottom Wave" is an indicator designed to analyze market conditions based on multiple smoothed price calculations and specific thresholds. It calculates several values such as B-value, VAR2-value, and additional signals like SK and SD to identify buy/sell levels and reversals, aiding traders in making informed decisions.
█ LOGICAL FRAMEWORK
The script consists of several main components:
• Input parameters that allow customization of calculation periods and thresholds.
• A custom function funding_wave that computes various financial metrics and conditions.
• Plotting commands to visualize different aspects of those computations.
Data flows from input parameters into the funding_wave function where calculations are performed. These results are then plotted according to specified conditions. The script uses conditional expressions to define when certain plots should appear based on the computed values.
█ CUSTOM FUNCTIONS
funding_wave Function:
This function takes six arguments: close_price, high_price, low_price, open_price, period_b, and period_var2. It performs several calculations including:
• Price range percentage normalized between lowest and highest prices over 60 bars.
• SMA of this value over periods defined by period_b and period_var2.
• Several moving averages (MA), EMAs, and extreme point markers (highest/lowest).
• Multiple condition checks involving these metrics leading to buy/high signal flags.
Returns: An array containing B-value, VAR2-value, SK-value, SD-value, along with various conditional signal indicators.
█ KEY POINTS AND TECHNIQUES
• Utilizes built-in TA functions (ta.highest, ta.lowest, ta.sma, ta.ema) for smoothing and normalization purposes.
• Implements extensive use of ternary operators and boolean logic to determine plot visibility based on specific criteria.
• Employs column-style plotting which highlights significant transitions in calculated metric levels visually.
• No explicit loops; computations utilize vectorized operations inherent to Pine Script's nature.
█ EXTENDED KNOWLEDGE AND APPLICATIONS
Potential modifications/extensions include:
• Adding alerts for key threshold crossovers or meeting certain conditions.
• Customizing more sophisticated alert messages incorporating current time and symbol details.
• Incorporating stop-loss/take-profit strategies dynamically adjusted by indicator outputs.
Similar techniques can be applied in:
• Developing robust trend-following systems combining momentum oscillators.
• Enhancing basic price action rulesets with statistical filters derived from historical data behaviors.
• Exploring intraday breakout strategies predicated upon sudden changes in market sentiment captured via volatility spikes.
Related concepts/features:
• Using arrays to encapsulate complex return structures for reusability across scripts/functions.
• Leveraging na effectively within plotting constructs ensures cleaner chart presentation avoiding clutter from irrelevant points.
█ MARKET MEANING OF DIFFERENT COLORED COLUMNS
Red Columns ("B above Var2"):
• Market Interpretation: When the red columns appear, it indicates that the B-value is higher than the VAR2-value. This suggests a strengthening upward trend or consolidation phase where the market might be experiencing buying pressure relative to recent trends.
• Trading Implication: Traders may consider this as a potentially bullish sign, indicating strength in the underlying asset.
Green Columns ("B below Var2"):
• Market Interpretation: Green columns indicate that the B-value is lower than the VAR2-value. This could suggest downward trend acceleration or weakening buying pressure compared to recent trends.
• Trading Implication: Traders might interpret this as a bearish signal, suggesting a possible decline in the market.
Aqua Columns ("SK below SD"):
• Market Interpretation: Aqua columns show instances where the SK-value is below the SD-value. This typically signifies that the short-term stochastic oscillator (or similar measure) is signaling oversold conditions but not yet reaching extremes.
• Trading Implication: While not necessarily a strong sell signal, aqua columns might prompt traders to look for further confirmation before entering long positions.
Fuchsia Columns ("SK above SD"):
• Market Interpretation: Fuchsia columns represent situations where the SK-value exceeds the SD-value. This usually indicates overbought conditions in the near term.
• Trading Implication: Traders often view fuchsia columns as cautionary signs, possibly prompting them to exit existing long positions or refrain from adding new ones without further analysis.
Yellow Columns ("High Condition" and "High Condition Both"):
• Market Interpretation: Yellow columns occur when either the SK-value or B-value crosses above predefined high thresholds (e.g., 90). If both cross simultaneously, they form "High Condition Both."
• Trading Implication: Strongly bullish signals indicating overheated markets prone to corrections. Traders may see this as a good opportunity to take profits or prepare for a pullback/corrective move.
Blue Columns ("Low Condition" and "Low Condition Both"):
• Market Interpretation: Blue columns emerge when either the SK-value or B-value drops below predefined low thresholds (e.g., 10). Simultaneous crossing forms "Low Condition Both."
• Trading Implication: Potentially bullish reversal setups once the market starts showing signs of bottoming out after being significantly oversold. Traders might use blue columns as entry points for establishing long positions or hedging against anticipated rebounds.
Light Purple Columns ("Low Condition with Reversal" and "Low Condition Both with Reversal"):
• Market Interpretation: Light purple columns signify moments when the SK-value or B-value falls below their respective thresholds but has started reversing upwards immediately afterward. If both fall and reverse together, it's denoted as "Low Condition Both with Reversal."
• Trading Implication: Suggests a possible early-stage rebound from an extended downtrend or sideways movement. This could be seen as a highly reliable bulls' flag formation setup.
White Columns ("High Condition with Reversal" and "High Condition Both with Reversal"):
• Market Interpretation: White columns denote scenarios where the SK-value or B-value breaches high thresholds (e.g., 90) but begins descending shortly thereafter. Both simultaneously crossing leads to "High Condition Both with Reversal."
• Trading Implication: Indicative of peak overbought conditions followed quickly by exhaustion in buying interest. This warns traders about potential imminent retracements or pullbacks, prompting exits or short positions.
█ SUMMARY TABLE OF COLUMN COLORS AND THEIR MEANINGS
Color Type Market Interpretation Trading Implication
Red B above Var2 Strengthening upward trend/consolidation Bullish sign
Green B below Var2 Downward trend acceleration/weakening buying pressure Bearish sign
Aqua SK below SD Oversold conditions but not extreme Cautionary signal
Fuchsia SK above SD Overbought conditions Take profit/precaution
Yellow High Condition / High Condition Both Overheated market, likely correction coming Good time to exit/additional selling
Blue Low Condition / Low Condition Both Possible bull/rebound setup Entry point/hedging
Light Purple Low Condition with Reversal / Low Condition Both with Reversal Early-stage rebound from downtrend Reliable bulls' flag formation
White High Condition with Reversal / High Condition Both with Reversal Peak overbought with imminent retracement Exit positions/warning
Understanding these color-coded signals can help traders make more informed decisions, whether for entry, exit, or risk management in trading strategies. Each set of colors provides distinct insights into market dynamics and trends, aiding in effective execution of trade plans.

Range Channel by Atilla YurtsevenThis script creates a dynamic channel around a user-selected moving average (MA). It calculates the relative difference between price and the MA, then finds the average of the positive differences and the negative differences separately. Using these averages, it plots upper and lower bands around the MA as well as a histogram-like oscillator to show when price moves above or below the average thresholds.
How It Works
Moving Average Selection
The indicator allows you to choose among multiple MA types (SMA, EMA, WMA, Linear Regression, etc.). Depending on your preference, it calculates the chosen MA for the selected lookback period.
Relative Difference Calculation
It then computes the percentage difference between the source (typically the closing price) and the MA. (diff = (src / ma - 1) * 100)
Positive & Negative Averages
- Positive differences are averaged and represent how far the price typically moves above the MA.
- Negative differences are similarly averaged for when price moves below the MA.
Range Channel & Oscillator
- The channel is plotted around the MA using the average positive and negative differences (Upper Edge and Lower Edge).
- The “Untrended” histogram plots the difference (diff). Green bars occur when price is above the MA on average, and red bars when below. Two additional lines mark the upper and lower average thresholds on this histogram.
How to Use
Identify Overbought/Oversold Zones: The upper edge can serve as a dynamic overbought level, while the lower edge can suggest potential oversold conditions. When the histogram approaches or crosses these levels, it may signal price extremes relative to its average movement.
Trend Confirmation: Compare price action relative to the channel. If price and the histogram consistently remain above the MA and upper threshold, it could indicate a stronger bullish trend. If they remain below, it might signal a prolonged bearish trend.
Entry/Exit Timings:
- Entry: Traders can look for moments when price breaks back inside the channel from an extreme, anticipating a mean reversion.
- Exit: Watching how price interacts with these dynamic edges can help define stop-loss or take-profit points.
Because these thresholds adapt over time based on actual price behavior, they can be more responsive than fixed-percentage bands. However, like all indicators, it’s most effective when used in conjunction with other technical and fundamental tools.
Disclaimer
This script is provided for educational and informational purposes only. It does not guarantee any specific outcome or profit. Use it at your own discretion and risk.
Trade smart, stay safe.
Atilla Yurtseven

ToolsPosLibrary "ToolsPos"
Library for general purpose position helpers
new_pos(state, price, when, index)
Returns new PosInfo object
Parameters:
state (series PosState) : Position state
price (float) : float Entry price
when (int) : int Entry bar time UNIX. Default: time
index (int) : int Entry bar index. Default: bar_index
Returns: PosInfo
new_tp(pos, price, when, index, info)
Returns PosInfo object with new take profit info object
Parameters:
pos (PosInfo) : PosInfo object
price (float) : float Entry price
when (int) : int Entry bar time UNIX. Default: time
index (int) : int Entry bar index. Default: bar_index
info (Info type from aybarsm/Tools/14) : Info holder object. Default: na
Returns: PosInfo
new_re(pos, price, when, index, info)
Returns PosInfo object with new re-entry info object
Parameters:
pos (PosInfo) : PosInfo object
price (float) : float Entry price
when (int) : int Entry bar time UNIX. Default: time
index (int) : int Entry bar index. Default: bar_index
info (Info type from aybarsm/Tools/14) : Info holder object. Default: na
Returns: PosInfo
PosTPInfo
PosTPInfo - Position Take Profit info object
Fields:
price (series float) : float Take profit price
when (series int) : int Take profit bar time UNIX. Default: time
index (series int) : int Take profit bar index. Default: bar_index
info (Info type from aybarsm/Tools/14) : Info holder object
PosREInfo
PosREInfo - Position Re-Entry info object
Fields:
price (series float) : float Re-entry price
when (series int) : int Re-entry bar time UNIX. Default: time
index (series int) : int Take profit bar index. Default: bar_index
info (Info type from aybarsm/Tools/14) : Info holder object
PosInfo
PosInfo - Position info object
Fields:
state (series PosState) : Position state
price (series float) : float Entry price
when (series int) : int Entry bar time UNIX. Default: time
index (series int) : int Entry bar index. Default: bar_index
tp (array) : PosTPInfo Take profit info. Default: na
re (array) : PosREInfo Re-entry info. Default: na
info (Info type from aybarsm/Tools/14) : Info holder object

Buy Low Sell High Composite Upgraded V6 [kristian6ncqq]NOTICE: This script is an upgraded and enhanced version of the original "Buy Low Sell High Composite" indicator by (published in 2017).
The original script provided a composite indicator combining multiple technical analysis metrics such as RSI, MACD, and MFI.
Why I Republished This Script
I found the original indicator to be exceptionally useful for identifying optimal accumulation zones for stocks or assets when prices are low (red area) and potential profit-taking zones when prices are high (green area).
To ensure it remains accessible and functional for modern trading strategies, I have updated and enhanced the original version with additional features and flexibility.
Intended Use
This indicator is designed for traders and investors looking to:
Accumulate stocks or assets when the price is in the low (red) zone.
Take profits or reduce positions when the price is in the high (green) zone.
The composite score provides a clear visualization of multiple technical indicators combined into a single actionable signal.
Enhancements in This Version
Updated to Pine Script v6 (from version 3).
Added input parameters for key settings (e.g., RSI length, MACD parameters, smoothing).
Introduced Chande Momentum Oscillator (CMO) and directional ADX for improved trend detection.
Implemented slope-based trend coloring for outer edges to highlight significant changes in trend direction.
Enhanced visualizations with customizable thresholds and smoothing for improved usability.
Credits
Original script: "Buy Low Sell High Composite" by , 2017.
URL to the original script: Buy Low Sell High Composite.
This script is designed to build upon the strengths of the original while adding flexibility and new features to meet the needs of modern traders.
RagiBaba's 3:1 Risk-to-Reward Tool with LeverageThis indicator allows you to visualize a 3:1 risk-to-reward ratio for your trades on the chart. It automatically calculates and displays the Stop Loss and Take Profit levels based on your input for:
Entry Price
Trade Amount ($)
Risk Amount ($)
Leverage (x)
You can adjust the following settings:
Trade Direction: Choose between a Long or Short position.
Leverage: Enter the leverage value (e.g., 25x).
Entry Price: Set the price at which you plan to enter the trade.
Risk and Reward: Input the amount of money you're willing to risk and the desired reward (automatically calculated as 3 times your risk).
Label Position: Choose the label position for Entry, Stop, and Target (left, center, or right on the chart).
Each line has a corresponding label showing the price for Entry, Stop Loss, and Take Profit. The labels can be positioned on the left, center, or right side of the chart for better readability.
This tool helps you manage your trades by giving you clear visual cues for your entry, stop loss, and take profit levels with the option to adjust for leverage.

Bollinger Breakout Strategy with Direction Control [4H crypto]Bollinger Breakout Strategy with Direction Control - User Guide
This strategy leverages Bollinger Bands, RSI, and directional filters to identify potential breakout trading opportunities. It is designed for traders looking to capitalize on significant price movements while maintaining control over trade direction (long, short, or both). Here’s how to use this strategy effectively:
How the Strategy Works
Indicators Used:
Bollinger Bands:
A volatility-based indicator with an upper and lower band around a simple moving average (SMA). The bands expand or contract based on market volatility.
RSI (Relative Strength Index):
Measures momentum to determine overbought or oversold conditions. In this strategy, RSI is used to confirm breakout strength.
Trade Direction Control:
You can select whether to trade:
Long only: Buy positions.
Short only: Sell positions.
Both: Trade in both directions depending on conditions.
Breakout Conditions:
Long Trade:
The price closes above the upper Bollinger Band.
RSI is above the midline (50), confirming upward momentum.
The "Trade Direction" setting allows either "Long" or "Both."
Short Trade:
The price closes below the lower Bollinger Band.
RSI is below the midline (50), confirming downward momentum.
The "Trade Direction" setting allows either "Short" or "Both."
Risk Management:
Stop-Loss:
Long trades: Set at 2% below the entry price.
Short trades: Set at 2% above the entry price.
Take-Profit:
Calculated using a Risk/Reward Ratio (default is 2:1).
Adjust this in the strategy settings.
Inputs and Customization
Key Parameters:
Bollinger Bands Length: Default is 20. Adjust based on the desired sensitivity.
Multiplier: Default is 2.0. Higher values widen the bands; lower values narrow them.
RSI Length: Default is 14, which is standard for RSI.
Risk/Reward Ratio: Default is 2.0. Increase for more aggressive profit targets, decrease for conservative exits.
Trade Direction:
Options: "Long," "Short," or "Both."
Example: Set to "Long" in a bullish market to focus only on buy trades.
How to Use This Strategy
Adding the Strategy:
Paste the script into TradingView’s Pine Editor and add it to your chart.
Setting Parameters:
Adjust the Bollinger Band settings, RSI, and Risk/Reward Ratio to fit the asset and timeframe you're trading.
Analyzing Signals:
Green line (Upper Band): Signals breakout potential for long trades.
Red line (Lower Band): Signals breakout potential for short trades.
Blue line (Basis): Central Bollinger Band (SMA), helpful for understanding price trends.
Testing the Strategy:
Use the Strategy Tester in TradingView to backtest performance on your chosen asset and timeframe.
Optimizing for Assets:
Forex pairs, cryptocurrencies (like BTC), or stocks with high volatility are ideal for this strategy.
Works best on higher timeframes like 4H or Daily.
Best Practices
Combine with Volume: Confirm breakouts with increased volume for higher reliability.
Avoid Sideways Markets: Use additional trend filters (like ADX) to avoid trades in low-volatility conditions.
Optimize Parameters: Regularly adjust the Bollinger Bands multiplier and RSI settings to match the asset's behavior.
By utilizing this strategy, you can effectively trade breakouts while maintaining flexibility in trade direction. Adjust the parameters to match your trading style and market conditions for optimal results!
